
Influencer Tiers Explained: Nano, Micro, Macro and Mega
Five follower bands, and the engagement numbers behind them. We measured 1,500 creators to check whether smaller really does mean more engaged.
TL;DR
- The bands: nano 1k to 10k, micro 10k to 50k, mid-tier 50k to 250k, macro 250k to 1M, mega above 1M. Industry convention, not a standard, so treat any brand's version as approximate.
- We measured 1,500 TikTok creators in our own index, 300 per tier, to test whether smaller really means more engaged.
- It does not, at least not steadily. Nano had the highest median at 7.0%, but mega came second at 6.5%, ahead of both micro (3.1%) and macro (3.9%).
- The tiers overlap heavily. The middle 50% of every tier spans a wide range, so a 12% nano and a 12% mega creator both exist in numbers.
- Use tier for budget and reach. Use engagement rate to pick the creator. The variation inside a tier is bigger than the variation between tiers.
Every influencer marketing guide uses the same five words. Nano, micro, mid-tier, macro, mega. Almost none of them agree on where the boundaries sit, and almost all of them repeat the same claim: smaller creators get better engagement.
We can check that second part, because we index millions of TikTok creators. So we did.
What are the influencer tiers?
The tiers are follower-count bands used to group creators by audience size. The most commonly used version looks like this, and it is the version we use below:
| Tier | Followers | Creators in our index |
|---|---|---|
| Nano | 1,000 to 10,000 | 12,820,941 |
| Micro | 10,000 to 50,000 | 2,434,184 |
| Mid-tier | 50,000 to 250,000 | 997,061 |
| Macro | 250,000 to 1,000,000 | 269,313 |
| Mega | 1,000,000+ | 71,239 |
There is no governing body here. Some platforms call 10k to 100k "micro", some stop nano at 5k, and some skip mid-tier entirely. If a media kit or an agency deck tells you a creator is "micro", ask for the follower number rather than trusting the label.
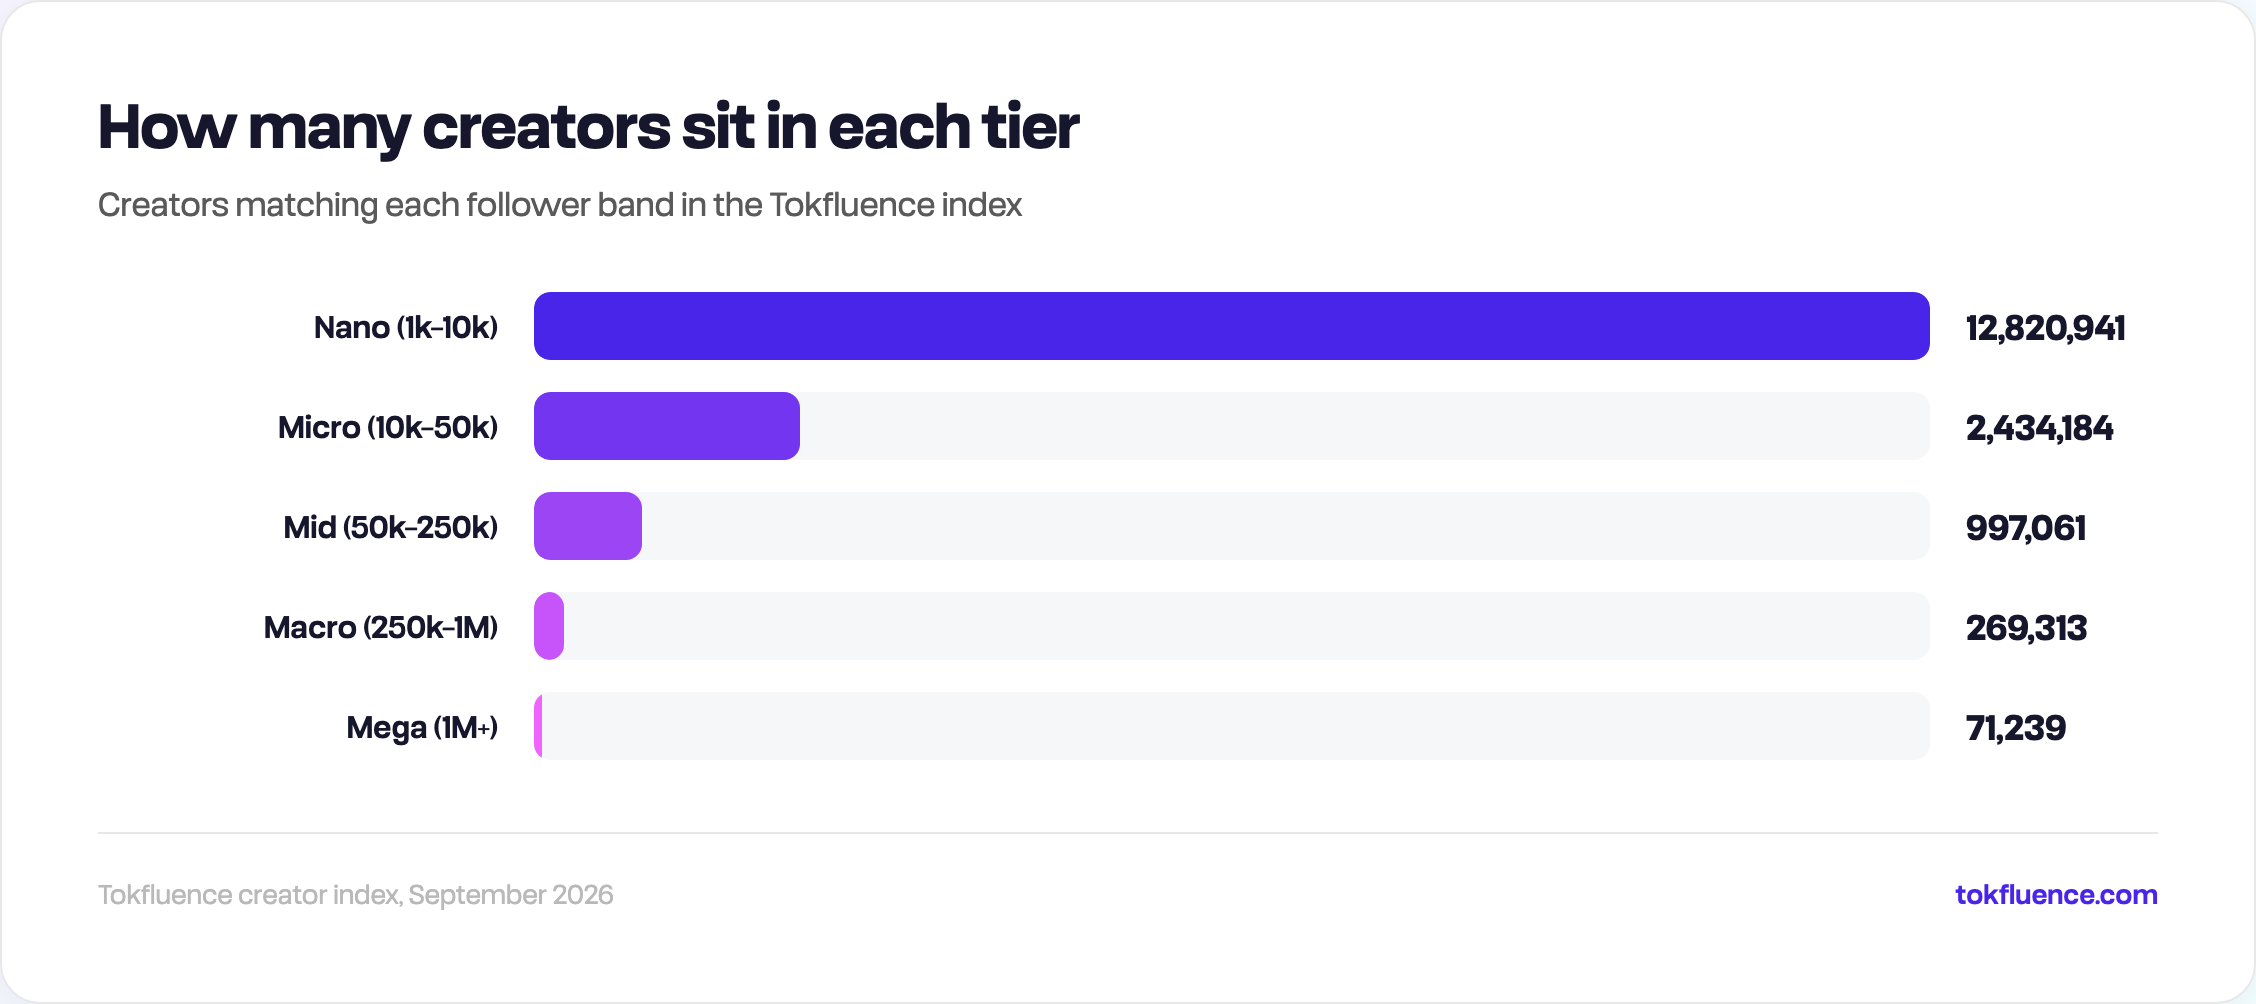
The tiers are wildly uneven in size. Nano creators outnumber mega creators by roughly 180 to 1.
That distribution matters more than it first appears. If your shortlist is built by browsing the biggest accounts in a niche, you are picking from the smallest pool available, competing with every other brand doing the same thing, and ignoring 12.8 million creators who are cheaper and easier to book.
What is a nano influencer?
A nano influencer has roughly 1,000 to 10,000 followers. In our sample they had the highest median engagement rate of any tier, at 7.0%, with the middle half of creators falling between 2.8% and 16.7%.
That spread is the interesting part. Nano is the most volatile tier by a wide margin: some accounts post to a genuinely tight community, others have followers who stopped watching months ago. A 7.0% median means half of them are below 7.0%, and the tier contains both 20% performers and 1% performers in large numbers.
Best for: product seeding at volume, hyper-local campaigns, and categories where a recommendation from someone who feels like a peer beats reach. Worst for: anything that needs guaranteed impressions, because a single nano creator's view count can swing by 10x post to post.
What is a micro influencer?
A micro influencer has roughly 10,000 to 50,000 followers. Median engagement in our sample was 3.1%, the lowest of any tier we measured, with the middle half between 1.4% and 7.7%.
This is the result we did not expect, and we want to be plain about it: micro is the tier most often recommended as the sweet spot between reach and engagement, and in our data it engaged the least. We are not confident enough in the sampling to tell you the conventional wisdom is wrong. We are confident enough to say we could not reproduce it.
Best for: the practical middle. Enough reach to matter, still affordable in bulk, and creators at this size usually answer their own emails. Worst for: assuming you get nano-level intimacy. At this size many creators are already running their account as a business.
What is a mid-tier influencer?
A mid-tier influencer has roughly 50,000 to 250,000 followers. Median engagement was 5.5%, second only to nano, with the middle half between 1.9% and 12.2%.
Mid-tier is the least discussed and, on this data, the most quietly reasonable choice. Creators here are established enough to deliver predictable view counts, small enough to still care about a single brand deal, and numerous enough that you have real choice.
Best for: campaigns that need both a floor on impressions and a creator who will actually make something considered. Worst for: budgets that only stretch to one or two placements, where a bigger name buys more attention per dollar of negotiation effort.
What is a macro influencer?
A macro influencer has roughly 250,000 to 1,000,000 followers. Median engagement was 3.9%, with the middle half between 1.5% and 8.3%.
Macro is where audiences start to get broad rather than specific. The follower count is impressive and the audience is often geographically and demographically scattered, which is exactly what you do not want if the product only makes sense for a narrow group.
Best for: awareness pushes, launches that need a visible name, and categories with mass appeal. Worst for: niche products, and any campaign judged on cost per engagement rather than cost per impression.
What is a mega influencer?
A mega influencer has more than 1,000,000 followers. Median engagement was 6.5%, which put them second highest in our sample, ahead of both micro and macro.
This is the other result that breaks the expected pattern. One plausible explanation is platform-specific: TikTok distributes by watch behaviour rather than follow graph, so a very large account's reach is not diluted across inactive followers the way it is on a follow-driven feed. Take that as a hypothesis, not a finding. We measured the engagement, not the cause.
Best for: launches where the creator's name is itself the message. Worst for: almost everything else, on cost grounds alone.
Does engagement rate actually drop as follower count rises?
Not cleanly, in our data. Here is the full picture:
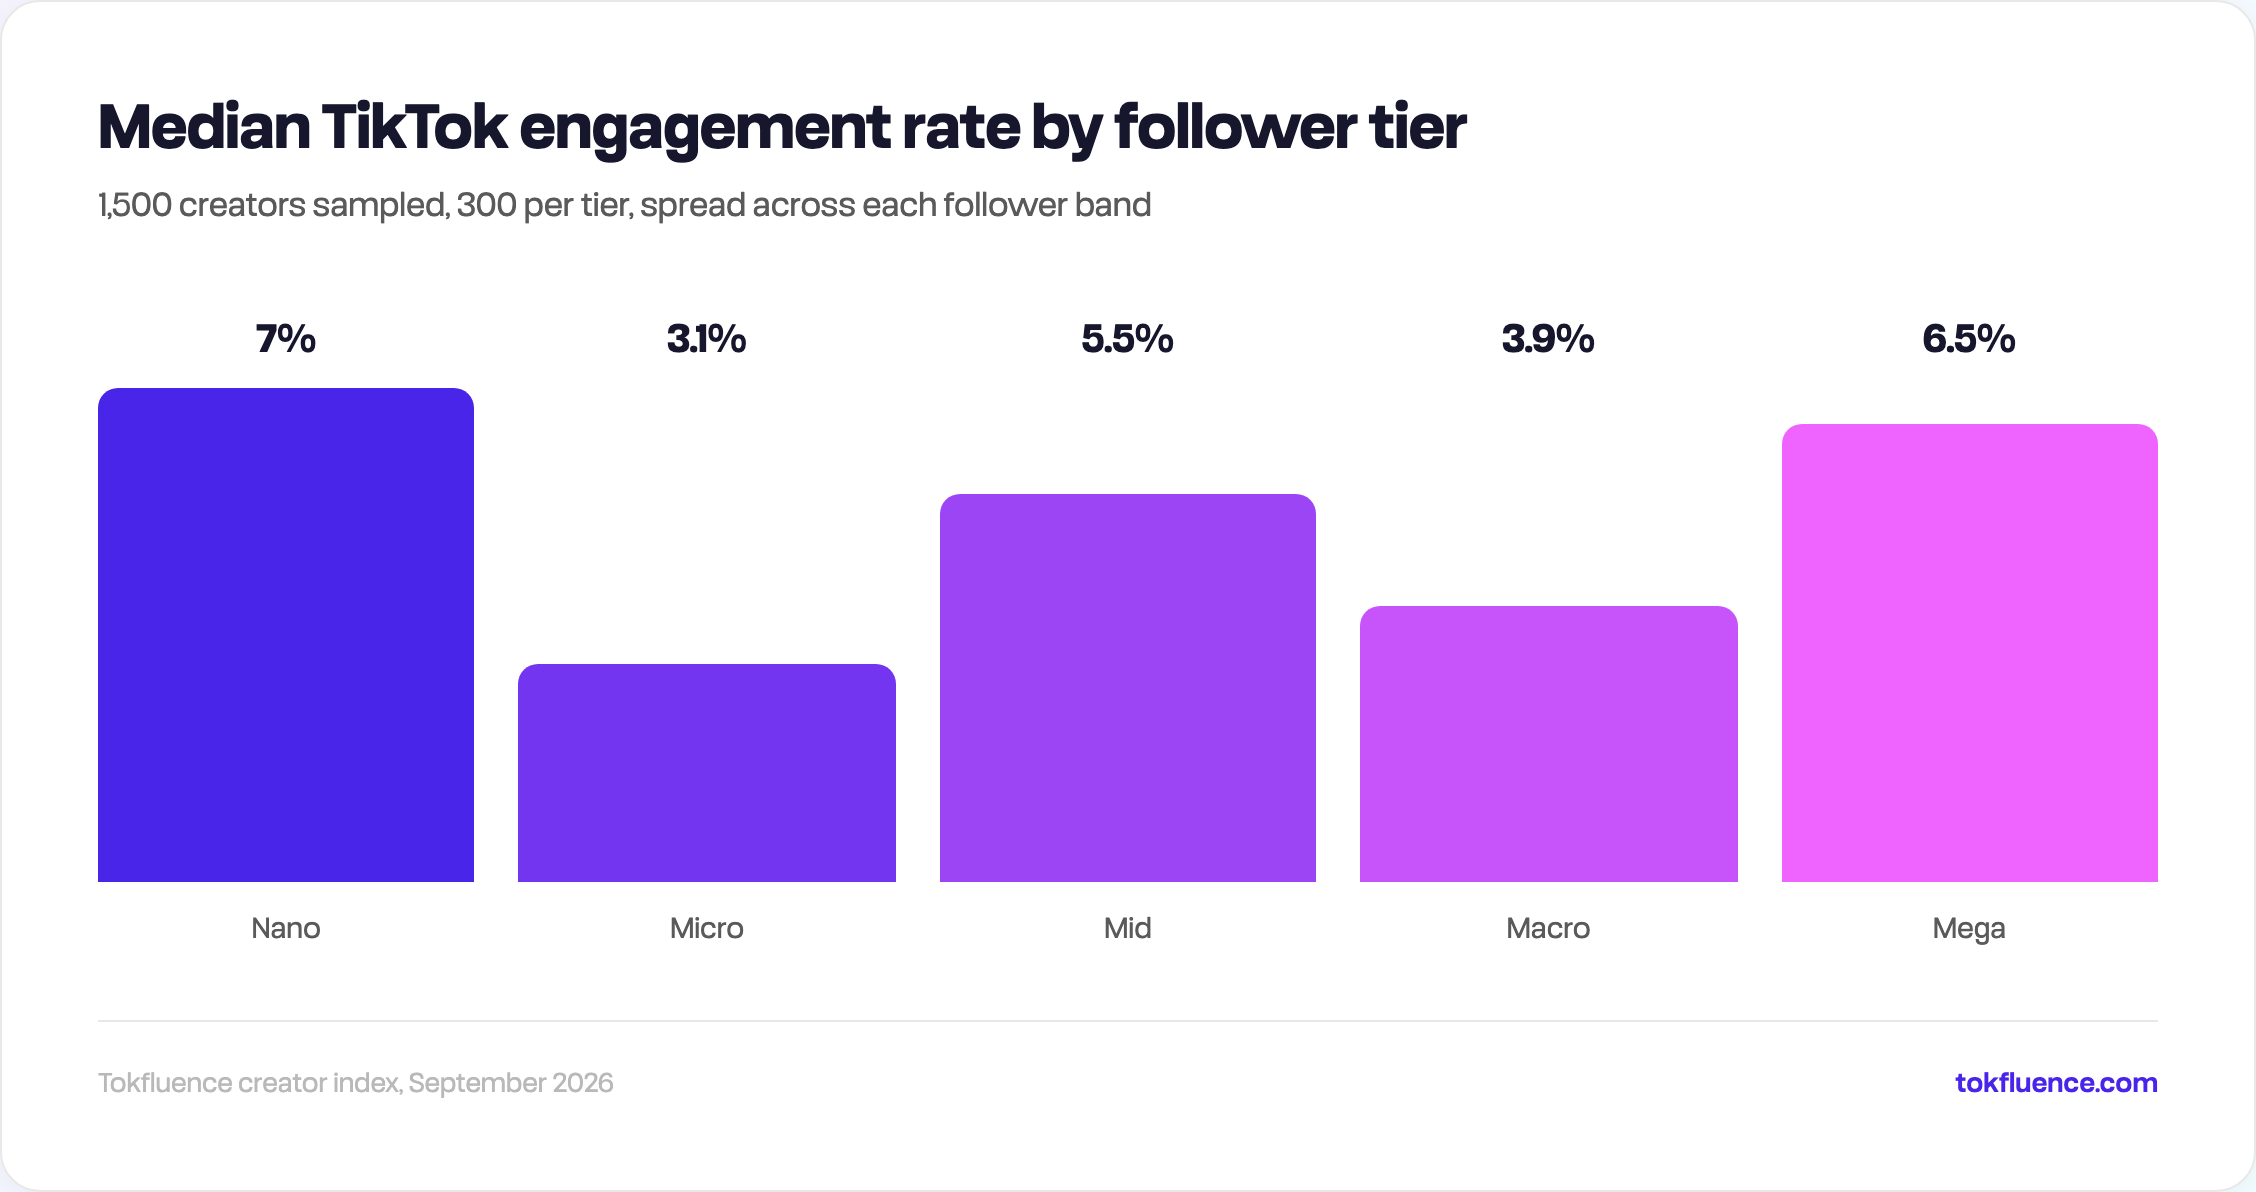
Median engagement rate by tier across 1,500 sampled creators. The expected smooth decline is not there.
| Tier | Median ER | Middle 50% |
|---|---|---|
| Nano | 7.0% | 2.8% to 16.7% |
| Micro | 3.1% | 1.4% to 7.7% |
| Mid-tier | 5.5% | 1.9% to 12.2% |
| Macro | 3.9% | 1.5% to 8.3% |
| Mega | 6.5% | 3.2% to 10.3% |
The directional claim survives at the extremes: the highest median is the smallest tier. Everything between is noisy, and the ordering zigzags.
Two honest caveats, because this is our own data and we would rather you knew its limits:
First, the sample is 300 creators per tier, drawn in three slices across each follower band so the numbers are not skewed toward the bottom of the range. That is enough to see a shape, not enough to settle a debate.
Second, the creators were returned by our search ranking rather than by random draw. We do not think that ordering targets engagement, but we cannot prove it is neutral either, and a non-random sample is the most likely explanation for the zigzag.
What we will say without hedging: the middle-50% ranges overlap heavily across every tier. A 12% nano creator and a 12% mega creator both exist in real numbers. Tier tells you roughly what a creator costs and how many of them there are. It does not tell you whether a specific account is worth booking.
Which tier should you pick?
Pick from the constraint that actually binds your campaign:
- Budget is the constraint. Nano and micro, in volume. You are buying many small bets instead of one large one.
- You need a guaranteed impression floor. Mid-tier or macro. Nano view counts are too volatile to forecast.
- The product is niche. Nano, micro or mid-tier, chosen by content fit rather than size. Macro audiences are usually too broad.
- The creator's name is the campaign. Mega, and accept the cost per engagement.
- You want the best odds on engagement. Ignore tier and filter by engagement rate directly. The variation inside a tier is bigger than the variation between tiers.
That last point is the practical takeaway from all of the above. Tier is a budgeting tool. It is a poor quality filter.
How do you check a creator's real engagement rate?
Look it up before you negotiate, not after. Engagement rate is views and interactions measured against follower count, and it is the single number that separates two creators who look identical on paper.
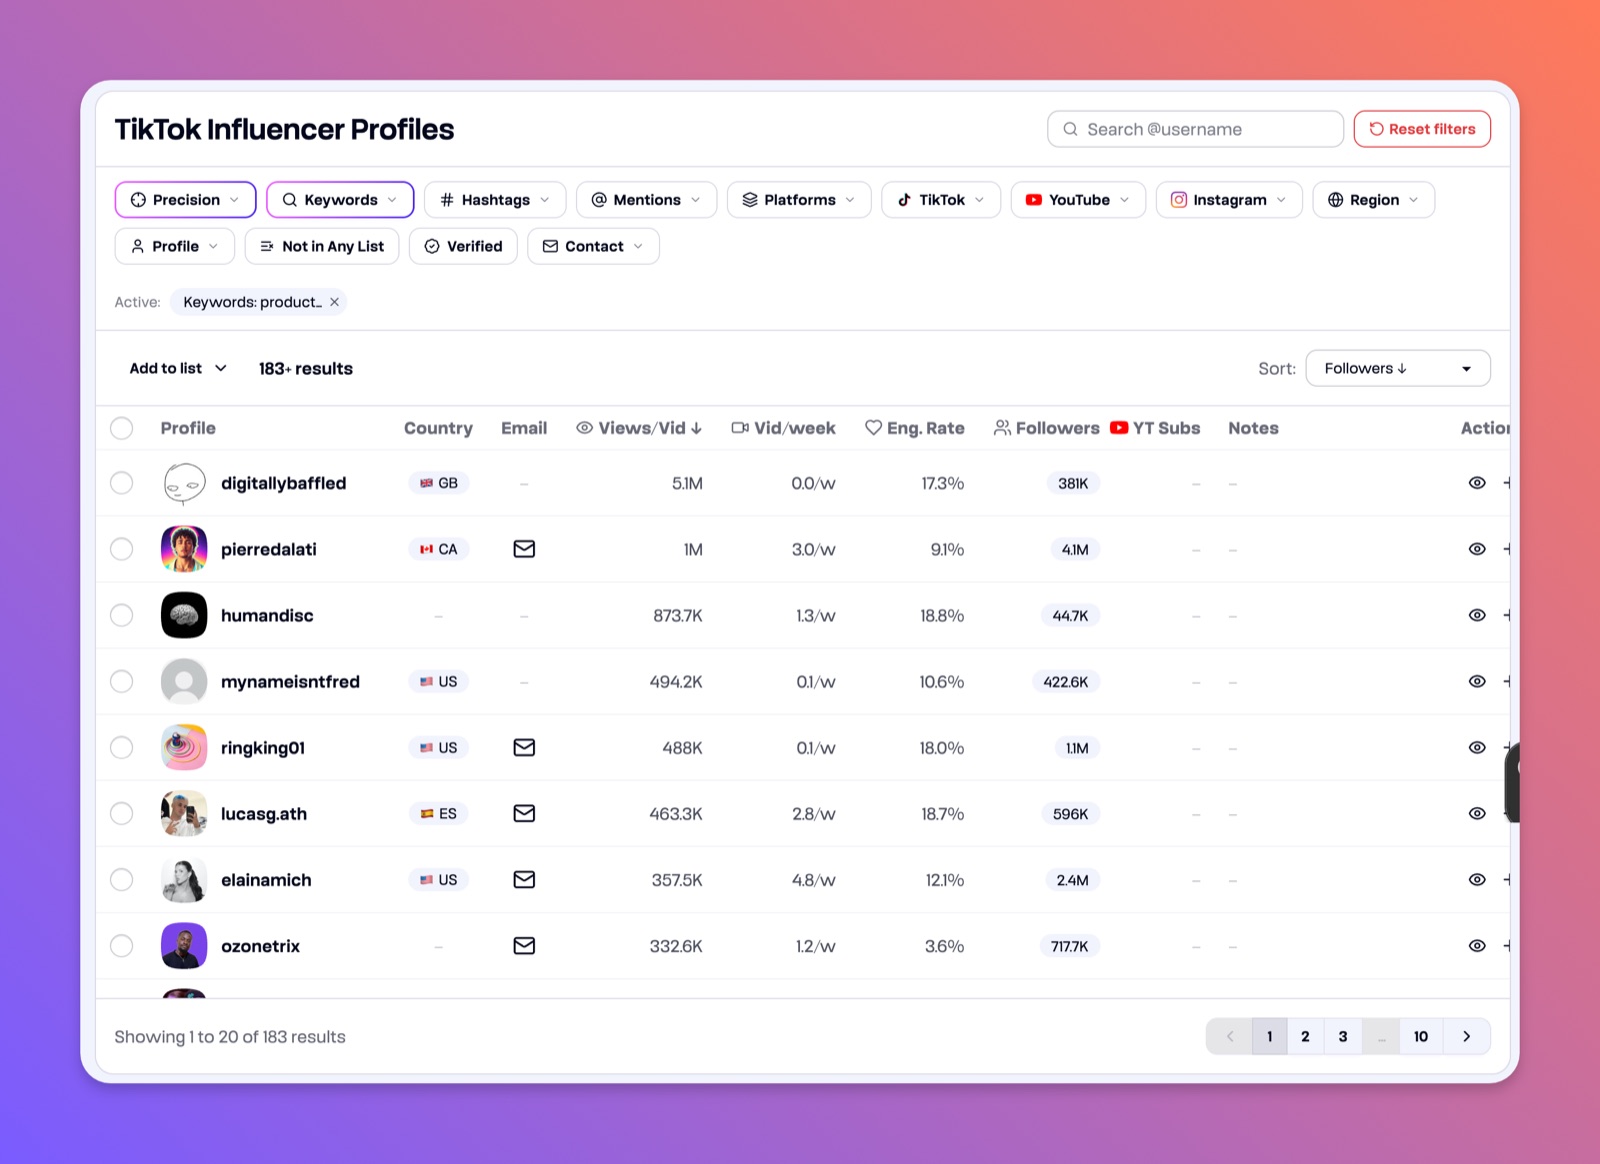
Filtering by engagement rate rather than follower count changes who makes the shortlist.
Three things worth checking on any creator before a brief goes out:
- Engagement rate against tier norms. Use the table above as the baseline. A 2% nano creator is underperforming their tier badly; a 5% macro creator is doing well.
- Views per video, not just followers. Follower count is historical. Views are current.
- Posting frequency. A high engagement rate on one post a month is a different proposition to the same rate on four a week.
You can filter TikTok creator search by follower band and engagement rate together, pull audience analysis on the shortlist to check the followers are real and in the right country, then track what the posts actually delivered with campaign tracking.
How we got these numbers
Every figure above comes from our own TikTok creator index, queried in September 2026.
For each of the five tiers we split the follower band into three slices and sampled 100 creators from each slice, giving 300 per tier and 1,500 in total. Slicing matters: an unsliced query returned creators bunched at the bottom of each band, which would have made the "micro" figure a measurement of 10,000-follower accounts rather than the 10,000 to 50,000 range.
Engagement rate is as recorded in our index at query time. Medians are reported rather than means because the distributions have long right tails, and a handful of viral accounts would otherwise drag the average somewhere unhelpful. The creator counts per tier are total index matches, not sample counts.
If you want the tier bands cut differently, or the same measurement on a specific niche or country, that is a filter away rather than a research project.