
How to Measure Influencer Marketing ROI
Most dashboards call revenue divided by spend ROI. It is not. Here are the formulas, what to track per goal, how to attribute sales on TikTok, and a worked example from spend to profit.
TL;DR
- The formula: ROI = (gross profit from the campaign − total campaign cost) ÷ total campaign cost × 100. Use profit, not revenue, and count every cost: fees, product, commission and your own time.
- Most dashboards report a revenue multiple, not ROI: revenue ÷ spend. A 3.7× revenue multiple in our worked example is a 31% profit ROI once margin and commission come out.
- Your break-even point is 1 ÷ gross margin: at a 50% margin you need 2× revenue on spend just to get your money back, before any affiliate commission.
- Pick the metric from the goal: CPM and cost per view for awareness, cost per click for traffic, cost per order and ROI for sales, cost per usable video for UGC.
- The caveat: every attribution method undercounts or overcounts. Codes leak, links lose people who buy later, and earned media value (EMV) is an estimate of ad value, not money you made.
Most guides to influencer marketing ROI give you one formula and a list of twenty metrics. That is not enough to answer the question your finance team will actually ask: did this make money?
This guide is built the other way round. The formulas come first, each with the maths written out. Then which numbers to track for which goal, how to attribute sales on TikTok (codes, links and TikTok Shop GMV), and one complete worked example from spend to profit. Benchmarks appear only where someone has published them, with the source.
What is the formula for influencer marketing ROI?
Influencer marketing ROI = (gross profit attributed to the campaign − total campaign cost) ÷ total campaign cost × 100. A result of 50% means every $1 spent came back as $1.50 of gross profit.
Two words in that formula do most of the work:
- Gross profit, not revenue. If you sell a $40 product that costs $20 to make and ship, a $40 sale is $20 of profit. Using revenue overstates ROI by the full cost of the goods.
- Total campaign cost, not just creator fees. Creator fees, product sent to creators, affiliate commission, agency or tool fees, and the hours your team spent on the campaign.
Here are the formulas you need, in one place:
| Metric | Formula | Use it to answer |
|---|---|---|
| ROI (profit) | (Gross profit − total cost) ÷ total cost × 100 | Did the campaign make money? |
| Revenue multiple (ROAS) | Attributed revenue ÷ total cost | How much revenue came back per $1? |
| CPM | Total cost ÷ views × 1,000 | What did 1,000 views cost? |
| Cost per view | Total cost ÷ views | Same as CPM, per single view |
| Engagement rate | (Likes + comments + shares + saves) ÷ views × 100 | Did the people who saw it react? |
| CPE (cost per engagement) | Total cost ÷ (likes + comments + shares + saves) | What did each reaction cost? |
| CPC (cost per click) | Total cost ÷ link clicks | What did each visit cost? |
| CPA (cost per acquisition) | Total cost ÷ orders (or sign-ups) | What did each customer cost? |
| Break-even revenue multiple | 1 ÷ (gross margin − commission rate) | What revenue multiple do you need to not lose money? |
Engagement rate on TikTok is usually calculated on views, not followers, because most views come from people who do not follow the creator. Some tools divide by followers instead, so check which one a report uses before comparing two numbers.
Why is a "4× ROI" usually not ROI?
Because it is a revenue multiple. Most influencer and ad dashboards, including ours, report revenue divided by spend and call it ROI or ROAS. That number is useful for comparing creators against each other, but it is not profit.
The gap matters. A 2× revenue multiple sounds good. At a 40% gross margin it loses money: $2 of revenue is $0.80 of profit for every $1 spent. The break-even multiple is 1 ÷ gross margin, and it rises fast as margins fall:
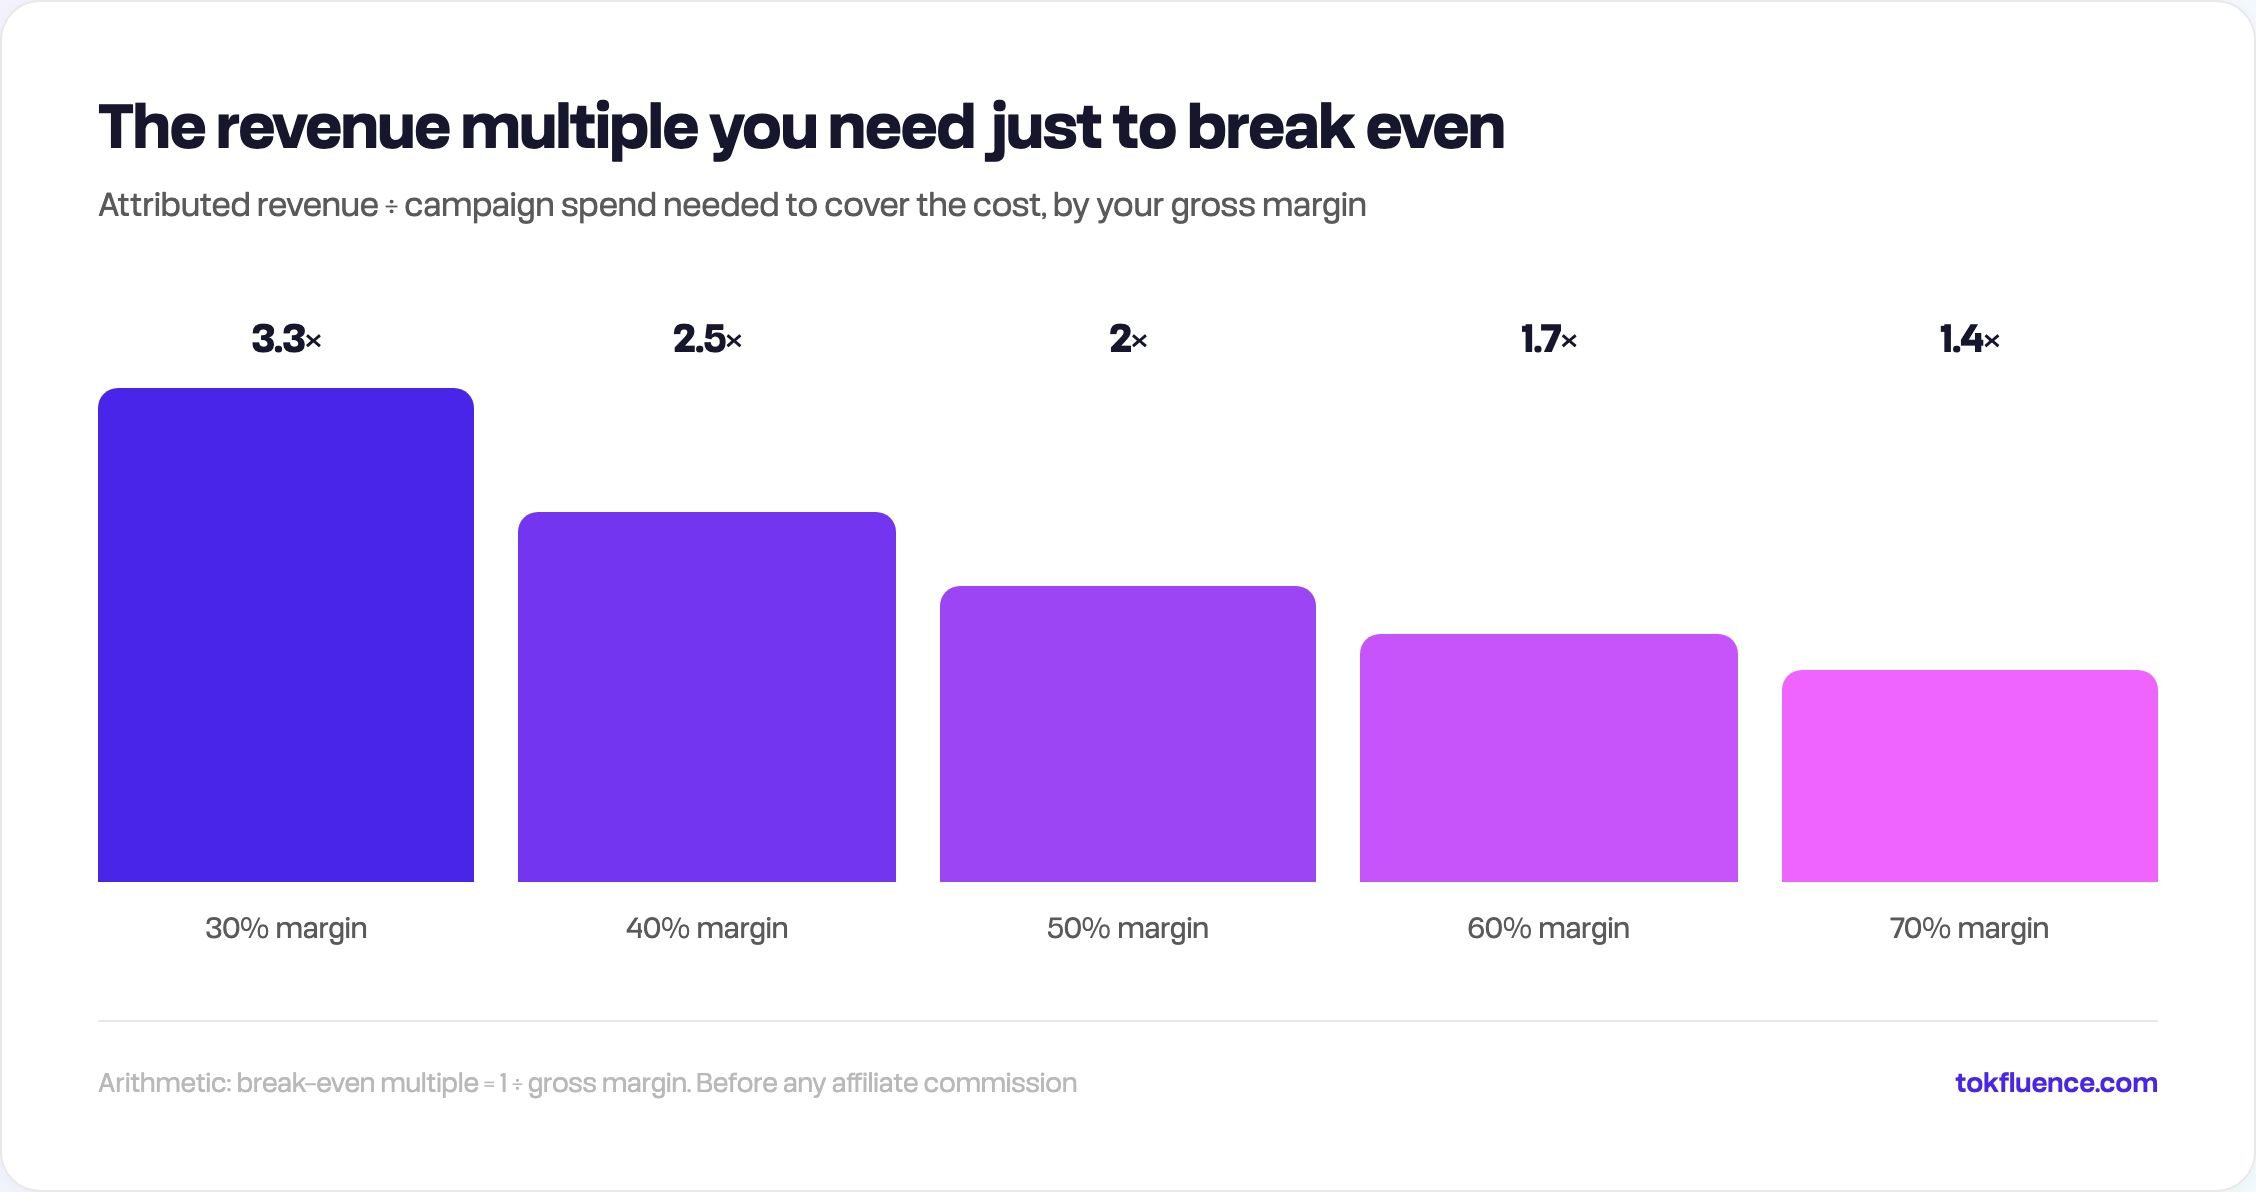
Break-even multiple = 1 ÷ gross margin. If you also pay creators a commission on sales, subtract it from the margin first: at a 50% margin and 15% commission, break-even is 1 ÷ 0.35 = 2.86×.
Work out your own break-even multiple before the campaign starts. It turns every revenue multiple in your report into a yes or a no.
What should you track for each campaign goal?
Track the metric that matches what the campaign is for, and ignore the rest until that one is answered. A campaign judged on everything is judged on nothing.
| Goal | Primary metric | Supporting metrics | Where the data comes from |
|---|---|---|---|
| Awareness | CPM (cost per 1,000 views) | Reach, engagement rate, branded search volume after the campaign | TikTok post stats, Google Search Console or Google Trends |
| Consideration and traffic | Cost per click | Engagement rate, time on site, email sign-ups | UTM-tagged links in your analytics |
| Sales on your own site | ROI and CPA | Revenue multiple, conversion rate, new vs returning customers | Discount codes, UTM links, post-purchase survey |
| Sales on TikTok Shop | ROI on GMV | Orders, revenue multiple, return rate | TikTok Shop Seller Center, Affiliate Center |
| UGC for ads | Cost per usable video | Hook rate, cost per acquisition on the ads | Your ad manager. See our UGC campaign guide |
Two notes on the table. Awareness campaigns do not have an ROI you can calculate honestly, so do not invent one; judge them on CPM against your other channels. And if you are running your first campaign, pick one row, not three. Our guide to running a first influencer campaign explains why deciding the measure comes before finding creators.
How do you attribute sales to an influencer?
With at least two methods at once, because each one misses a different group of buyers. The Influencer Marketing Hub 2026 benchmark report (600+ respondents, a vendor survey) found promo codes were the most used measurement tool, chosen by 45.9% of those answering, ahead of affiliate links (26.0%) and native shop features (25.0%).
| Method | How it works | What it misses or inflates |
|---|---|---|
| Unique discount code | One code per creator, set up in your store | Codes leak to coupon sites, so some "attributed" orders were never influenced. Buyers who forget the code are missed. |
| UTM-tagged link | A link with utm_source, utm_medium and utm_campaign per creator, read in your analytics | People who watch on TikTok and buy days later on another device are lost. Links in TikTok captions are not clickable, so it relies on bio links or link tools. |
| TikTok Shop affiliate link | The creator tags your product; TikTok reports the sale against them | Only covers sales inside TikTok Shop, not your site or Amazon. |
| Post-purchase survey | "Where did you hear about us?" at checkout, with creator names as options | Self-reported and partial, but catches buyers who used no code or link. |
| Before and after comparison | Compare sales, branded search and direct traffic in the weeks before and after | Seasonality and other campaigns mix in. Works best when the campaign is the only thing that changed. |
Set up UTM links like this, one per creator, using Google's own campaign URL guidance:
https://yourstore.com/product?utm_source=tiktok&utm_medium=influencer&utm_campaign=spring-launch&utm_content=creatorhandle
Keep the values lowercase and consistent, and use utm_content for the creator handle so every creator is a separate row in your report.
For TikTok Shop, use GMV per creator. TikTok's Affiliate Seller Analytics in Seller Center shows GMV, orders and the creators, videos and LIVEs that drove them. GMV is gross merchandise value: the value of the orders, before returns, platform fees and the commission you pay the creator. It is the revenue figure, not your profit, so it goes into the revenue multiple, and gross profit after commission goes into ROI. If you sell on TikTok Shop, our guide on how to find TikTok Shop creators covers picking creators who already sell.
What about earned media value (EMV)?
Treat EMV as an estimate of what the views would have cost as ads, not as a return. EMV usually multiplies impressions or engagements by an assumed ad price, and there is no standard formula: the same campaign gives different EMV figures depending on which CPM and which engagement weights a tool picks. Even influencer platforms that report EMV have questioned it; Aspire published a piece titled Is EMV BS? on exactly this.
If you must report it, put the formula and the CPM next to the number, and never add EMV to sales revenue. A cleaner alternative is your actual CPM compared with what you pay for 1,000 views in paid ads on the same platform. Both numbers are real.
What does a worked example look like?
Here is a complete calculation for a fictional skincare brand selling through TikTok Shop. The numbers are illustrative, chosen to be round, not benchmarks.
The campaign: 10 micro creators, one video each, a flat fee of $300 per creator plus 15% affiliate commission on sales through their TikTok Shop links.
Step 1: add up every cost.
| Cost | Calculation | Amount |
|---|---|---|
| Creator fees | 10 × $300 | $3,000 |
| Product sent to creators | 10 × $25 product cost | $250 |
| Team time | 10 hours × $50 | $500 |
| Spend before commission | $3,750 | |
| Affiliate commission | 15% × $14,000 GMV | $2,100 |
| Total cost | $5,850 |
Step 2: read the results. Seller Center shows $14,000 of GMV from 350 orders at a $40 average order value. The videos got 1,200,000 views and 48,000 likes, comments, shares and saves.
Step 3: work out the metrics.
| Metric | Calculation | Result |
|---|---|---|
| CPM | $3,750 ÷ 1,200,000 × 1,000 | $3.13 |
| Engagement rate | 48,000 ÷ 1,200,000 × 100 | 4.0% |
| CPE | $3,750 ÷ 48,000 | $0.08 |
| CPA (including commission) | $5,850 ÷ 350 | $16.71 |
| Revenue multiple | $14,000 ÷ $3,750 | 3.73× |
Step 4: work out the profit ROI. Say the gross margin after product cost and TikTok Shop fees is 50%.
- Gross profit before commission: 50% × $14,000 = $7,000
- Minus commission: $7,000 − $2,100 = $4,900
- Minus spend: $4,900 − $3,750 = $1,150 profit
- ROI: $1,150 ÷ $3,750 × 100 = 31%
ROI uses $3,750 as the cost base because the commission was already taken out of profit. Counting it twice would understate the result.
Step 5: check it against break-even. At a 50% margin and 15% commission, break-even is 1 ÷ (0.50 − 0.15) = 2.86×. The campaign returned 3.73×, so it made money. At a 35% margin, the same 3.73× would lose money: break-even would be 1 ÷ (0.35 − 0.15) = 5×.
The same campaign is a "3.7× ROI" in a dashboard and a 31% return on paper. Both are true. Only the second one tells you whether to do it again.
What are good influencer marketing benchmarks?
There are fewer trustworthy ones than the internet suggests. Many "average ROI" figures trace back to old vendor surveys with no stated method, so we do not repeat them. These are the ones with a source we can show:
| Benchmark | Figure | Source and type |
|---|---|---|
| Cost per 1,000 views, median TikTok creator at the cheapest published rate | $43 to $165, depending on tier | Our rates by tier analysis: published rates divided by views measured in the Tokfluence index, October 2026 |
| Same rates, creators in the top quarter of their tier for views | $11 to $43 per 1,000 views | Same analysis |
| A brand-side ceiling on CPM | "A maximum of $20" per 1,000 views | One practitioner quoted by Modash, cited in our rates analysis. One person's rule, not a market standard |
| Most used attribution tool | Promo codes, 45.9% of respondents | Influencer Marketing Hub 2026 benchmark report, vendor survey |
| Share of teams naming ROI or attribution as a challenge | 15.84% of reported challenges combined | Same report |
The useful reading of the CPM rows: picking creators by views rather than followers cuts what you pay for 1,000 views by a factor of two to four at the same rate. That is usually the cheapest ROI improvement available, and it happens before the campaign starts.
How do you track influencer ROI in Tokfluence?
Tokfluence's campaign tracking puts every creator's TikTok posts, spend and sales in one dashboard, and does the formulas above for you. It is the tool we build, so weigh this section accordingly.
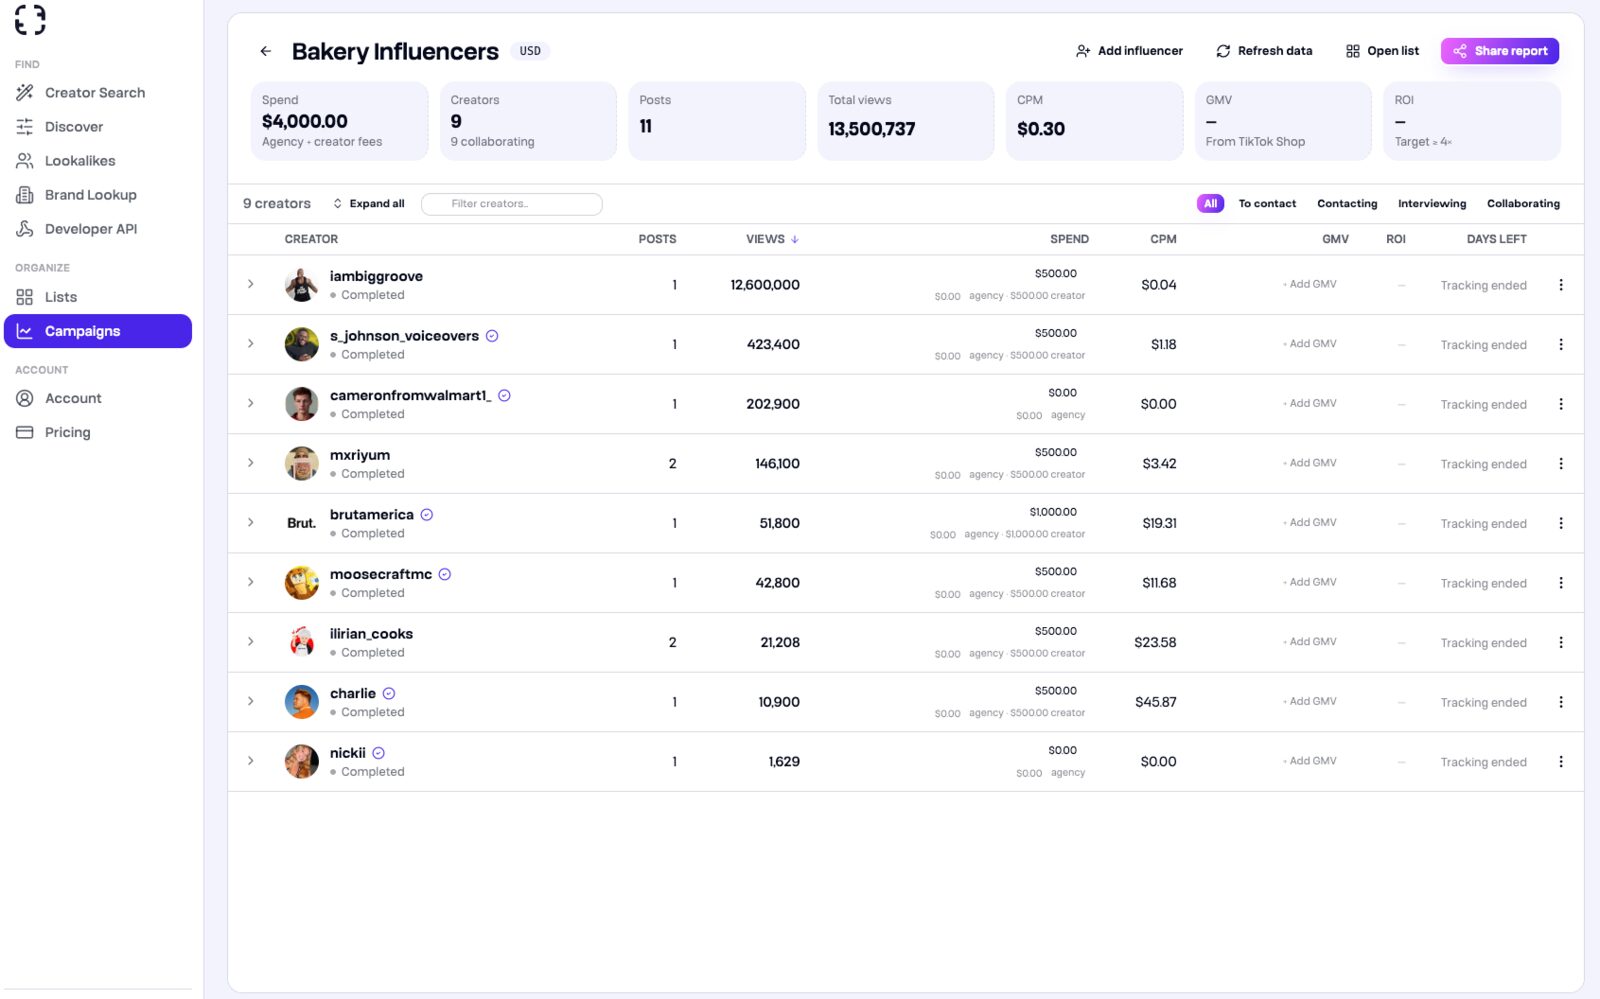
A nine-creator campaign: $4,000 of spend, 13.5 million views, a $0.30 CPM. GMV and ROI stay empty until sales are entered.
What it tracks, per campaign and per creator:
- Spend, split into creator fee and agency fee, so agency costs count towards the total.
- Posts and views. Paste the TikTok post URLs; it pulls views, likes, comments and shares and refreshes them for 30 days after each post is added.
- CPM, worked out from spend and views for each creator and the whole campaign.
- GMV, which you enter per creator from TikTok Shop's Affiliate Center (or from your store, for code or link sales).
- ROI, calculated as GMV ÷ spend and colour-coded: green at 4× or more, amber from 2×, red below. That is the revenue multiple from earlier, so compare it with your own break-even multiple, not with the colours alone.
The screenshot shows why per-creator numbers matter. One post got 12.6 million of the campaign's 13.5 million views. Take that creator out, and the other eight cost $3,500 for 900,737 views: $3,500 ÷ 900,737 × 1,000 = $3.89 CPM, about 13 times the headline figure. A campaign average can hide the fact that most of it underperformed.
You can share a live report link with a client or your manager; they do not need a Tokfluence account. With API access (not included in Pro), the same campaign metrics (spend, GMV, ROI, CPM) come through the Tokfluence API, if you would rather pull them into your own reporting.
Then rebook from the numbers. The output of an ROI review is a short list of creators to work with again, and a gap where the underperformers were. To fill it, search the TikTok creators in our index with filters for followers, engagement, average views, region and TikTok Shop activity, and filter by "has email" to keep creators who publish contact details. If your niche is thin, on Pro Tokfluence's MCP server can start a live TikTok crawl from a chat with an AI assistant for 250 credits, and the new creators become searchable a few hours later. A static creator database cannot fill a gap on request like that.
What it costs. One credit is one creator profile. Pro is $99 a month and includes 10,000 email reveals a month, plus 20,000 searches, 3 Ultra Searches and campaign tracking. Existing Agency subscriptions are a legacy plan and are not offered to new customers. There is a free plan with no card; you add a card only at checkout (pricing). Discovery Service is a legacy plan and is not offered to new customers.
When is another tool the better pick?
When most of your sales happen off TikTok, or you need multi-touch attribution across channels. Tokfluence tracks TikTok posts and the GMV you enter; it does not connect to your store, read your discount codes or model attribution across Instagram, YouTube and paid ads. A Shopify-connected affiliate tool or your analytics platform is the right place for that, and Tokfluence sits next to it as the TikTok view.
What are the most common mistakes in measuring influencer ROI?
Five, and each one makes a campaign look better or worse than it was:
- Using revenue instead of profit. A 3× revenue multiple can lose money at a 30% margin. Always check against your break-even multiple.
- Leaving costs out. Product, commission and team time are real costs. Leaving them out flatters every campaign by the same amount, so the error never shows up in comparisons.
- Judging too early. TikTok can push a video days after it is posted, and buyers do not always purchase the day they first see a product. Wait at least 72 hours before judging a post, and longer before judging sales.
- Trusting a single attribution method. Codes alone overcount (leaks) and undercount (forgotten codes) at the same time. Use two methods and read the gap between them.
- Reporting EMV as return. It is an estimate of ad value, not money. If the only positive number in the report is EMV, the campaign did not pay back.
Sources
- Influencer Marketing Hub, Influencer Marketing Benchmark Report 2026: measurement tools and challenges (vendor survey, 600+ respondents).
- Google Analytics Help, URL builders: collect campaign data with custom URLs: UTM parameters.
- TikTok Shop Academy, How to use Affiliate Seller Analytics: GMV by creator, video and LIVE.
- Aspire, Is EMV BS? Rethinking influencer marketing ROI: the case against EMV as a return metric.
- Tokfluence, What TikTok creators actually charge, by follower tier: CPM by tier, published rates divided by measured views.
- Tokfluence pricing and campaign tracking: plans, credits and what the dashboard calculates.