
TikTok Engagement Rate: How It Is Calculated and What Is Good
Two formulas, two very different numbers. Here is how to calculate TikTok engagement rate by hand, and what counts as good by tier and by niche, from 1,641 creators we measured.
TL;DR
- The formula: TikTok engagement rate is (likes + comments + shares) ÷ views × 100. Divide by followers instead and you get a different number that answers a different question, so always ask which one you are looking at.
- What is good: across 1,641 active TikTok creators we measured in five niches, the median engagement rate by views was 6.3%, and the middle half sat between 3.8% and 10.0%. Above 10% is strong; below about 4% is weak for the niche.
- Niche moves it more than size: comedy creators had a median of 8.8% and recipe creators 4.5%. Mid-tier, macro and mega creators were within one point of each other (5.3% to 6.3%).
- Followers tell a different story: by followers, the median fell from 1.4% at nano to 0.2% at mega, a 7x drop. The "small creators engage more" claim is mostly a follower-formula effect.
- The caveat: engagement rate measures how hard an audience reacts, not how big it is. In our sample it was almost unrelated to average views.
Engagement rate is the number every media kit leads with and the one most often compared across formulas that do not match. A 9% from one tool and a 2% from another can describe the same creator. This guide shows the formulas, works one creator through each of them so you can check the maths yourself, and gives you benchmarks measured from our own TikTok creator index, by tier and by niche.
If you want the tier definitions themselves (nano, micro, mid-tier, macro, mega) and what each is good for, our influencer tiers article covers that. This one goes deeper on the metric.
How is TikTok engagement rate calculated?
TikTok engagement rate is the interactions on a video divided by its views, times 100. Interactions are usually likes, comments and shares; some tools add saves.
There are four versions in common use, and they give very different answers:
| Version | Formula | Answers the question | Used by |
|---|---|---|---|
| By views, per post | (likes + comments + shares) ÷ views × 100 | Did people who saw this video react to it? | TikTok-first tools, campaign reports |
| By views, per creator | Total or median interactions ÷ total or median views, over recent posts | How hard does this creator's audience usually react? | Creator databases, including Tokfluence |
| By followers, per post | (likes + comments + shares) ÷ followers × 100 | How much reaction did this video get relative to audience size? | Instagram-style tools, older media kits |
| By followers, per creator | Average interactions per post ÷ followers × 100 | How active is the follower base, on average? | Same, and many free calculators |
On TikTok, use views as the denominator. Most TikTok views come from the For You feed, which shows videos to people who do not follow the creator. Dividing by followers mixes two unrelated numbers: how many people saw the video, and how many people once pressed follow.
What the main sources use:
- Tokfluence calculates engagement rate as 100 × (likes + comments + shares) ÷ views, from the median likes, comments, shares and views of the posts read at a creator's last analysis. Our API treats a rate above 35% as not credible and leaves it empty (Tokfluence API docs).
- Modash's TikTok calculator takes "the median number of engagements (likes + comments etc.) across all the influencer's TikTok posts, divide by the median number of views", over the most recent 30 posts (Modash).
- Socialinsider's TikTok benchmarks use "total interactions (likes, comments, shares, saves) divided by views × 100" (Socialinsider).
All three divide by views. They still differ on saves and on median versus average, so compare a creator against benchmarks built with the same formula.
How do you calculate TikTok engagement rate by hand?
Take the creator's last 10 to 20 videos, skip pinned ones, and add up likes, comments, shares and views. Here is a worked example with five videos from a fictional creator with 40,000 followers:
| Video | Views | Likes | Comments | Shares | Interactions | ER by views |
|---|---|---|---|---|---|---|
| 1 | 12,000 | 900 | 40 | 60 | 1,000 | 8.3% |
| 2 | 8,500 | 610 | 25 | 15 | 650 | 7.6% |
| 3 (went viral) | 150,000 | 9,000 | 300 | 1,200 | 10,500 | 7.0% |
| 4 | 6,000 | 520 | 30 | 10 | 560 | 9.3% |
| 5 | 9,500 | 640 | 35 | 25 | 700 | 7.4% |
| Total | 186,000 | 13,410 |
The same five videos give five different "engagement rates", depending on the method:
| Method | Calculation | Result |
|---|---|---|
| By views, totals | 13,410 ÷ 186,000 × 100 | 7.2% |
| By views, average of each post's rate | (8.3 + 7.6 + 7.0 + 9.3 + 7.4) ÷ 5 | 7.9% |
| By views, median post | Middle value of the five rates | 7.6% |
| By followers, average interactions | (13,410 ÷ 5) ÷ 40,000 × 100 | 6.7% |
| By followers, median interactions | 700 ÷ 40,000 × 100 | 1.8% |
Two lessons from the table:
- The views-based versions agree. 7.2% to 7.9% is the same creator, described three ways. Pick one and use it consistently.
- The follower-based average is wrecked by one viral video. Video 3 alone carries most of the interactions, so the follower-based average (6.7%) is nearly four times the follower-based median (1.8%). If a media kit quotes a follower-based rate, ask whether it is an average.
The formula to paste into a spreadsheet, with likes in column B, comments in C, shares in D and views in E:
Per post:    =(B2+C2+D2)/E2*100
Per creator: =SUM(B2:D20)/SUM(E2:E20)*100
You do not need a calculator tool for this. You need the right denominator and at least 10 recent posts, because a rate built from two or three videos swings too much to compare.
What is a good engagement rate on TikTok?
A good TikTok engagement rate by views is above about 6%, which was the median in our sample, and a strong one is above 10%. Below about 4% is weak for most niches. Here is the full range by tier, measured across 1,641 active creators in five niches:
| Tier | Creators | Bottom 10% | Bottom quarter | Median | Top quarter | Top 10% |
|---|---|---|---|---|---|---|
| Nano (1k to 10k) | 219 | 2.4% | 4.7% | 8.3% | 15.4% | 23.3% |
| Micro (10k to 50k) | 289 | 2.5% | 3.7% | 6.8% | 11.5% | 17.4% |
| Mid-tier (50k to 250k) | 334 | 2.4% | 3.6% | 5.3% | 8.6% | 13.7% |
| Macro (250k to 1M) | 366 | 2.5% | 3.8% | 6.1% | 9.2% | 12.6% |
| Mega (1M+) | 433 | 2.3% | 3.8% | 6.3% | 9.4% | 13.6% |
| All | 1,641 | 2.4% | 3.8% | 6.3% | 10.0% | 15.4% |
Engagement rate by views, (likes + comments + shares) ÷ views. Measured: Tokfluence creator index, 16 October 2026, active individual creators in fitness, recipes, makeup, comedy and gaming. Method at the end of the article.
How to read it:
- Below the bottom quarter for the tier: weak. Fine for pure reach buys, poor for anything that needs a reaction.
- Between the bottom and top quarter: normal. Judge the creator on content fit and views instead.
- Above the top quarter: strong. Check the comments to make sure the reactions are real (more on outliers below).
Two things stand out. First, the bottom of every tier is the same: one creator in ten sits under about 2.5% whatever their size. Second, above nano the medians barely move. Mid-tier, macro and mega were 5.3%, 6.1% and 6.3%. Only nano stands clearly higher, and its spread is far wider too.
Outside benchmarks are in the same range once you match the formula. Socialinsider measured an average of 4.20% by views across 2 million TikTok videos in 2025, with every follower band between 3.75% and 4.40% (Socialinsider). Its sample includes brand accounts and its figure is an average, so it is not directly comparable with our creator medians, but the shape is the same: flat across sizes. Modash publishes "average" bands that run from 12.06% to 14.04% for 1k to 5k followers down to 6.20% to 6.84% above 1M (Modash).
Our tiers article, which sampled creators across all topics in September, found a lower micro median (3.1%). The creators here are niche-matched and active, which lifts the middle tiers. Both samples agree on the practical point: the spread inside a tier is far bigger than the difference between tiers.
Does engagement rate depend on the niche?
Yes, and more than it depends on size. Comedy creators had a median engagement rate of 8.8%; recipe creators had 4.5%. That gap is wider than the gap between any two tiers above nano.
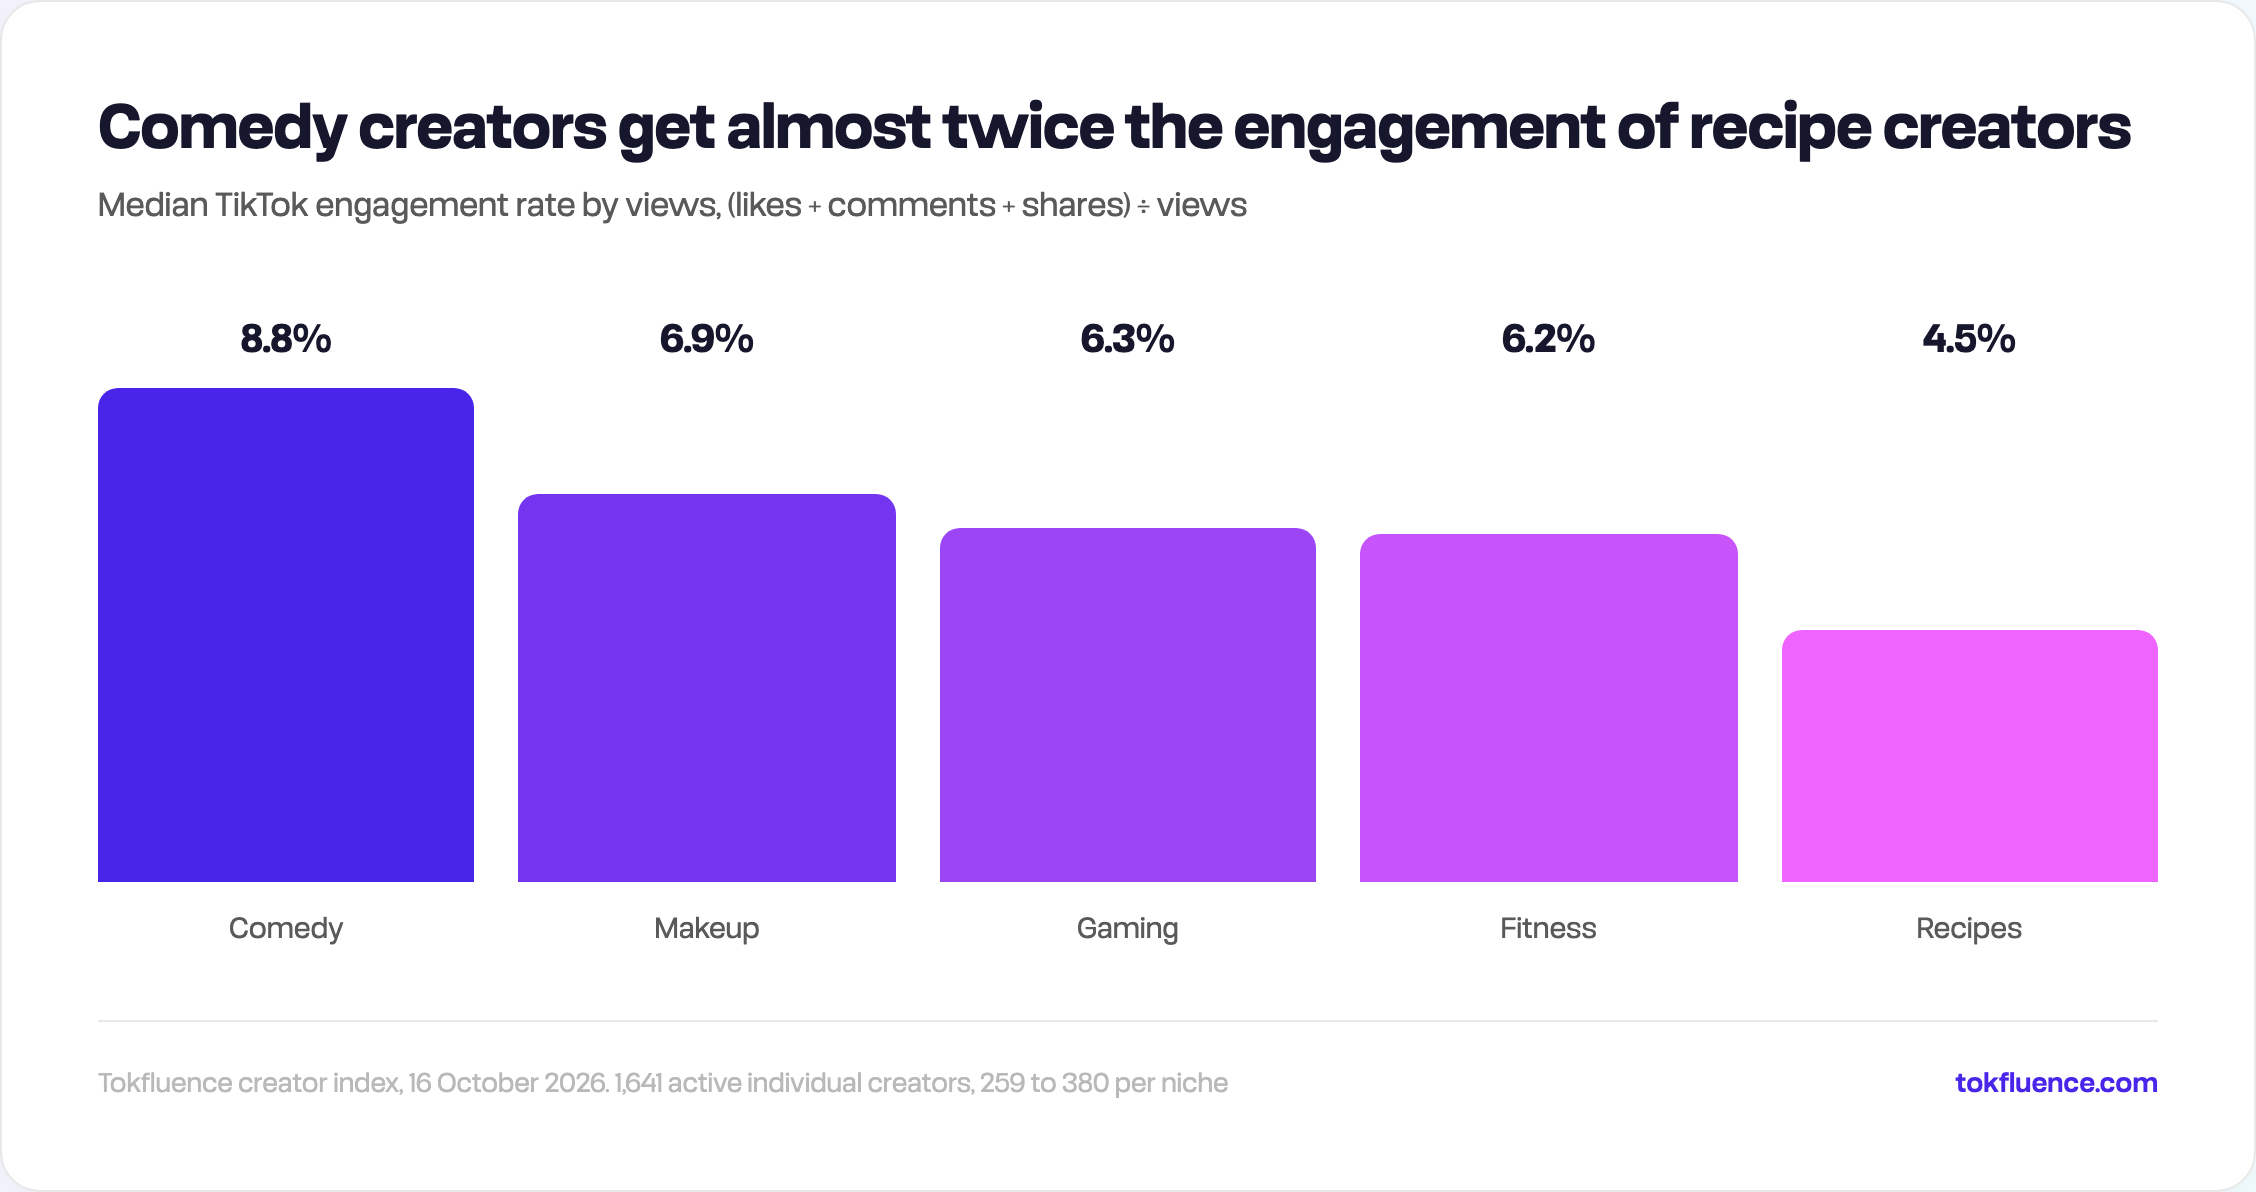
Measured: Tokfluence creator index, 16 October 2026. 1,641 active individual creators, 259 to 380 per niche.
| Niche | Bottom quarter | Median | Top quarter |
|---|---|---|---|
| Comedy | 6.0% | 8.8% | 13.6% |
| Makeup | 4.3% | 6.9% | 10.2% |
| Gaming | 3.6% | 6.3% | 9.8% |
| Fitness | 3.8% | 6.2% | 9.9% |
| Recipes | 3.1% | 4.5% | 6.7% |
The bottom quarter of comedy (6.0%) is above the median of recipes (4.5%). So a 5% recipe creator is doing well and a 5% comedy creator is not. One plausible reason: people like and share a joke on the spot, while a recipe is often watched, saved and cooked later, and our formula does not count saves. That is a hypothesis; we measured the gap, not the cause.
Medians by niche and tier, by views:
| Niche | Nano | Micro | Mid-tier | Macro | Mega |
|---|---|---|---|---|---|
| Comedy | 18.6% | 10.4% | 7.5% | 8.5% | 7.7% |
| Gaming | 10.5% | 7.3% | 5.6% | 5.4% | 5.6% |
| Makeup | 9.0% | 7.7% | 6.0% | 5.8% | 6.4% |
| Fitness | 8.5% | 6.5% | 5.7% | 5.9% | 6.1% |
| Recipes | 4.4% | 4.1% | 4.0% | 5.3% | 5.4% |
27 to 91 creators per cell; the smallest cells (nano comedy and gaming) are the least reliable.
Recipes is the one niche where big creators engaged more than small ones. In the other four, nano was highest and everything from mid-tier up sat in a narrow band. When you compare a creator, compare against their niche row, not a single "good engagement rate" figure.
Why does engagement by followers fall so fast?
Because views do not grow with followers. Engagement by followers is engagement by views multiplied by the share of followers who actually watch, and that share shrinks as an account grows. Same 1,641 creators, follower formula:
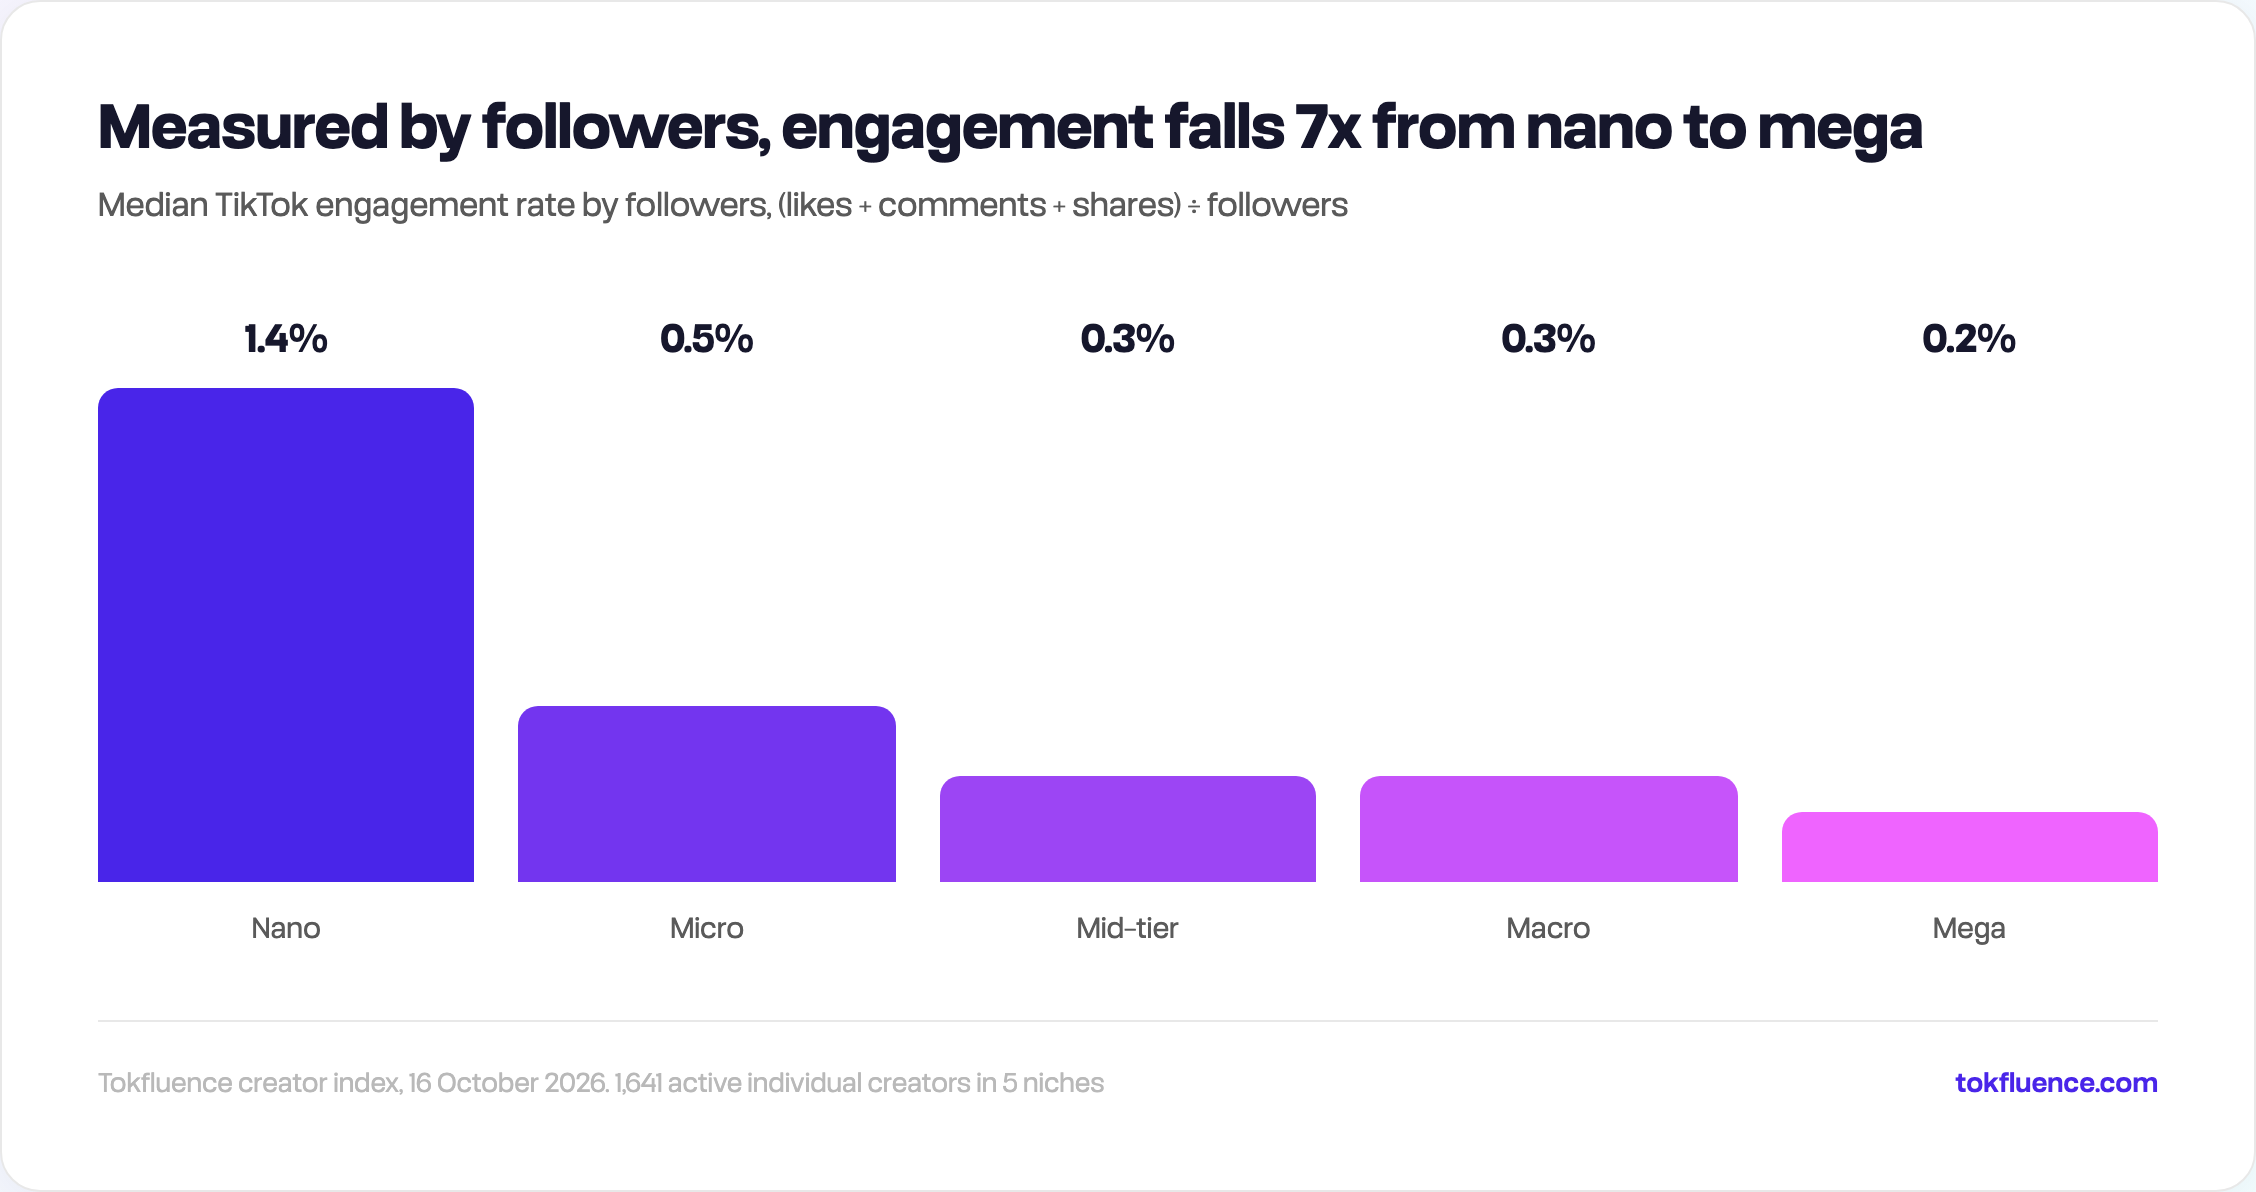
Derived as engagement rate by views × average views ÷ followers. Tokfluence creator index, 16 October 2026.
| Tier | ER by views (median) | Average views as % of followers (median) | ER by followers (median) |
|---|---|---|---|
| Nano | 8.3% | 15.6% | 1.4% |
| Micro | 6.8% | 9.3% | 0.5% |
| Mid-tier | 5.3% | 5.6% | 0.3% |
| Macro | 6.1% | 4.3% | 0.3% |
| Mega | 6.3% | 3.5% | 0.2% |
By views, a mega creator's audience reacts about as much as a macro or mid-tier creator's. By followers, the mega creator looks seven times worse than a nano. Nothing about the audience changed; only the denominator did. A large share of mega followers simply no longer watch, which our fake followers guide covers as a reach check.
The two formulas also pick different creators. Across all 1,641, we took the top quarter by views-based rate and the top quarter by follower-based rate: only 43% of creators were on both lists (177 of 410). Shortlist on the wrong formula and more than half of your "top engagers" change.
Our recommendation: use engagement by views to judge how an audience reacts, and views as a share of followers to judge reach. Do not use engagement by followers on TikTok unless a client insists, and then label it.
How do you spot a misleading engagement rate?
Treat any rate in the top 10% for its tier as a question, not a win. Very high rates are real for some creators and misleading for others, and the number alone will not tell you which.
How common the extremes were in our sample:
| Tier | Share at 15% or more | Share under 2% |
|---|---|---|
| Nano | 26% | 8% |
| Micro | 14% | 7% |
| Mid-tier | 6% | 8% |
| Macro | 5% | 6% |
| Mega | 8% | 6% |
A quarter of nano creators sat at 15% or more. At that size a single video with 300 views and 60 likes is a 20% rate, so small numbers swing hard. What to check when a rate looks too good:
- Views per video. A high rate on a few hundred views is a small, loyal audience, not reach. In our sample, engagement rate and average views were almost unrelated (rank correlation of minus 0.12), so a high rate never implies big views.
- The comments. Comment-bait ("comment LINK and I will DM you") and giveaways inflate comments without interest in the content. Read three recent videos.
- Likes against views, post by post. Bought likes show up as rates that stay almost identical whatever the views. Real engagement rises and falls with the content.
- The formula. A media kit rate of 25% is often follower-based on a viral post, or calculated over two or three videos. Ask for the method and the post count.
At the other end, a rate under 2% usually means a passive audience: views without reactions. It is not proof of fake views, but a creator there needs to win on reach or content quality, because they will not win on reaction.
For a fuller checklist, including follower growth and audience location, see how to spot fake followers. If you are reading the numbers off a pitch deck, our guide to reading an influencer media kit covers which ones to trust.
How do you use engagement rate to pick creators?
Use it as the second filter, after views. Views tell you whether a creator reaches enough people for your budget; engagement rate tells you whether those people react. A strong shortlist needs both.
A practical order:
- Set the follower band you can afford. Our TikTok creator rates by tier article has the costs.
- Keep creators with healthy views for their tier. Average views as a share of followers, against the table above.
- Then filter by engagement rate for the niche. Keep creators above the niche's bottom quarter from the niche table.
- Check the top 10% by hand. Comments, likes against views, post count.
- After the campaign, measure the posts, not the profile. The engagement rate on your sponsored videos is what you paid for. Our influencer marketing ROI guide covers how to put that next to cost.
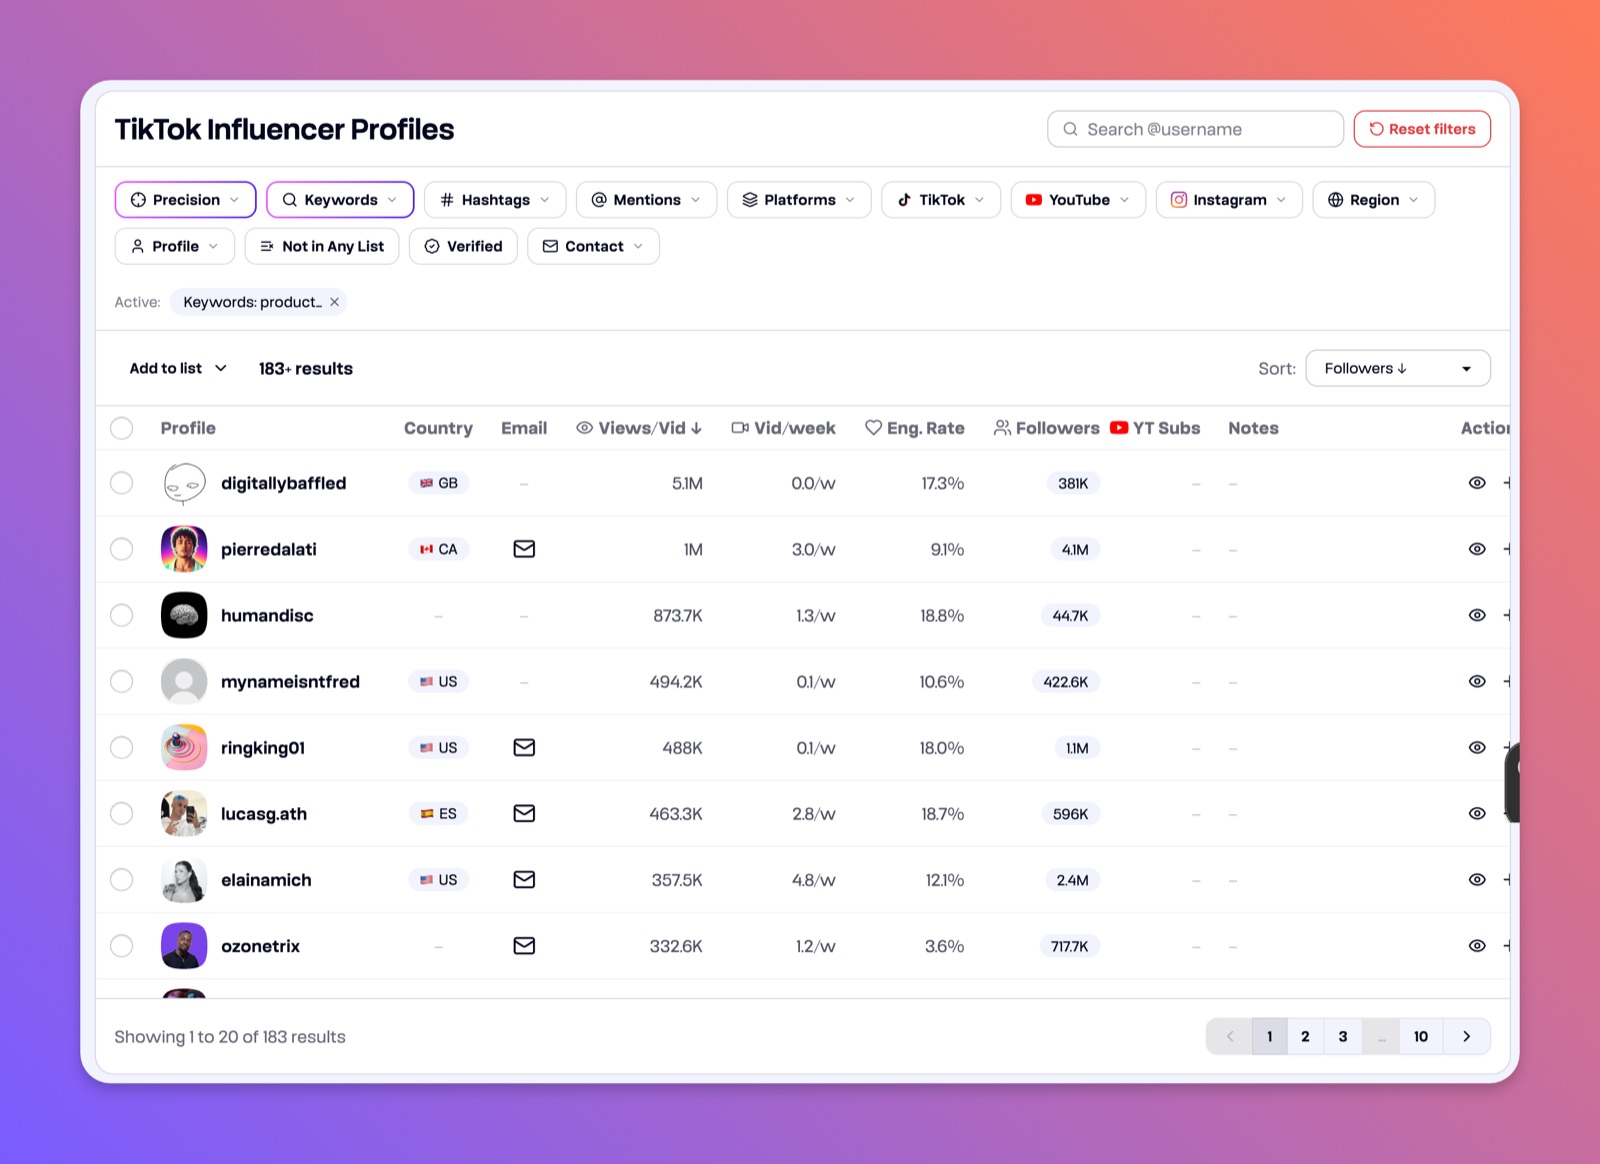
In Tokfluence, every creator shows followers, average views and engagement rate side by side.
In Tokfluence creator search, every creator profile shows followers, average views per video, engagement rate and posting frequency, all calculated the views-based way described above. You can set a minimum engagement rate and a minimum average views together, sort a whole search by engagement rate or by views, and filter for creators who list a contact email. Tokfluence shows contact details where creators publish them. For the few you are about to book, the on-demand audience analysis report adds follower growth and authenticity signals. After the posts go live, campaign tracking reports engagement rate per post, on views, so you compare like for like.
If a niche looks thin, the Tokfluence MCP server, available on Pro, can start a live TikTok crawl from a chat with an AI assistant for 250 credits, and the new creators become searchable a few hours later (best TikTok MCP servers). That is how this kind of benchmark can be extended to a niche we have not covered yet.
On price, one credit is one creator profile. Pro is $99 a month and includes 10,000 credits a month, shared across email reveals, the API and MCP (1 email reveal = 1 credit), plus 20,000 searches. Existing Agency subscriptions are a legacy plan and are not offered to new customers. Discovery Service is a legacy plan and is not offered to new customers.
Pick a different tool if you only need to check one creator once: the free calculators from Modash and others give you a views-based rate for a single handle in seconds, and the spreadsheet formula above does the same with no signup.
How we got these numbers
Measured figures come from the Tokfluence creator index, queried on 16 October 2026. We searched five keywords (fitness, recipes, makeup, comedy, gaming) in five follower bands (1,000 to 10,000; 10,000 to 50,000; 50,000 to 250,000; 250,000 to 1,000,000; over 1,000,000), individual accounts only (no brand accounts), last analysed within 180 days, and read the first 100 relevance-ranked creators in each of the 25 searches: 2,495 creators. We kept those with an engagement rate and an average views figure on record, posting roughly once a month or more (0.25 posts a week or more), which left 1,641.
- Engagement rate by views is the index's own figure: 100 × (likes + comments + shares) ÷ views, from the median of each over the posts read at the creator's last analysis. Saves are not included.
- Engagement rate by followers is derived: engagement rate by views × average views per video ÷ followers. It is an estimate built from two index fields, not a separate measurement.
- Percentiles, not averages, because the distributions have long right tails.
What this does not prove:
- Our index is not all of TikTok. It is a large sample of creators with 1,000+ followers, not a census, and these are the top of relevance-ranked searches, not a random draw.
- Five niches. Other niches will differ, which is the point of the niche table. No region filter, so each sample mixes countries.
- The index leaves out implausible rates. Rates above 35% are treated as not credible and left empty, so the very top of the nano tier is cut off.
- Profile rates are recent-post snapshots. One viral post or one quiet month moves them.
Sources
- Tokfluence, API reference: creators, read 16 October 2026.
- Modash, TikTok engagement rate calculator, read 16 October 2026.
- Socialinsider, TikTok benchmarks, read 16 October 2026.
- Tokfluence, pricing, read 16 October 2026.